Vis3
Data and Task Abstraction
Data Abstraction
Dataset의 종류는 무한이기 때문에 data 종류별로 visualize 방법을 정의해야 한다
Type of data: structural interpretation Semantics of data: real world meaning Metadata: Additional data required for interpreting data (types, semantics, syntax)
Data abstraction을 위해서는 세 가지를 알아야 한다,
Data
- Item: Individual entity
- Attribute: Property that can be measured, observed, logged (ex: dimension)
- Link: Relationshup between items
- Grid: Geometric/Topological 관계를 보여주는 data
- Position: Spatial data (직접적인 위치)
Dataset
- Table: Item과 attribute을 포함
- Network: Items, links, attributes을 포함
- Fields: Grids, Positions, Attributes (Continuous domain)
- Sampling: Measure 주기
- Interpolation: Sampled points 중간을 어떻게 채울 것인가
Grid geometry: Cells location in space Grid topology: How cells connect with neighboring cells
- Geometry: Items, Positions
- Clusters(grouping), Sets(unordered), Lists(ordered): Items
Attribute
- Categorical
- Implicit ordering 없음 (ex: movie genres)
- Operators: = = 또는 ! =
- Ordered
- Ordinal: Ordering이 있지만 arithmetic이 의미 없음 (shirt sizes)
- Quantative: Ordering과 arithmetic 가능 (length, prices)
- Interval: 차이가 의미있지만 absolute zero는 없음
- Ratio: 차이가 의미있고 absolute zero도 있음 (Kelvin temperature)
- 곱하기 나누기 가능
- Operators: = = 또는 ! = 또는 >,< (Arithmetics는 quantative data에서만 가능)
Ordered attribute type에는 ordering direction도 중요하다. Sequential: Min to max가 정해져있음 Diverging: zero point으로부터 방향이 두 갈래 Cyclic: 일주일처럼 계속 증가해도 starting point으로 돌아감
Attribute Semantics 데이터가 데이터셋에서 어떤 역할을 하는가를 의미
- Key: index for look up (ex: ID, 좌표값)
- Value: look up되는 값
Task Abstraction
사람이 하고싶은 task도 무한이기 때문에 각 task마다 별도의 visualize 방법은 정의하는 것은 비효율적이다. 따라서 큰 범주로 정의 (Abstract)하고 그 범주마다 방법을 정의해야 한다. ex) Compare values between two groups
Actions
Analyze: 무엇을 위해 사용하는가 Search: 관심 대상을 어떻게 찾는가 Query: 대상에 대해 무엇을 알아보는가
High level: Analyze
- Consume
- 이미 생성된 information을 사용하는 것
- Consume을 하는 방법은 세 가지로 나뉜다.
- Discover
- 이전에 몰랐던 정보를 찾는 것
- 이때 hypothesis을 verify하거나 disconfirm 하기
- Present
- 이미 알려진 정보를 설명하는 것
- Enjoy
- Visualization 감상
- Produce
- 이미 생성된 information으로 새로운 information을 얻는 것
- Produce을 하는 방법도 세 가지로 나뉜다
- Annotate
- Annotations 적기
- Record
- Saving / Capturing visualization elements
Annotate은 일시적인 정보를 붙이는 것이고 record는 영구적인 것을 저장하는 것
- Saving / Capturing visualization elements
- Derive
- 새로운 data elements을 존재하는 data elements으로부터 얻는 것
- ex: changing types of attribute, augmenting, apply operations
Mid level: Search
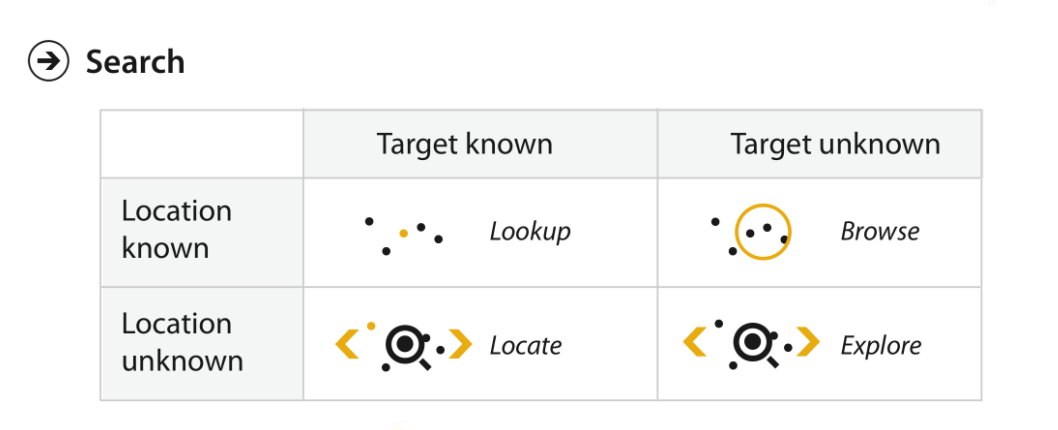
사람(Target)을 찾는다고 했을 때 이 정보가 있는 location은 포유류 섹션
- Lookup: 사람이 포유류 섹션에 있다는 것을 알고 찾기
- Locate: 사람이 어떤 섹션에 있는지 모르고 찾기
- Browse: 포유류 섹션을 훑어보기
- Explore: Species tree 전체를 훑어보기
Low level: Query
- Identify: 하나의 target의 특징 반환
- Compare: 여러 target의 특징 반환
- Summarize: 모든 것의 comprehensive view 반환
Targets
Action의 대상도 정의해야 한다
Data level
- Trends: High level characterization of data (증가한다, peak이다, 등)
- Outliers: Trend에 맞지 않는 정보
- Features: Interest의 구조
Attribute level
- Distribution: ex) 공부 시간의 분포
- Extremes: ex) 가장 오래 공부하는 학생
- Dependency ex) 성적이 공부 시간과 관련이 있는지
- Correlation ex) 성적과 공부 시간이 비례하는지
- Similarity ex) 성적과 공부 시간 dimension에서 학생들 간의 유사도
Network dataset에서는 target이 topology와 path Spatial dataset에서는 target이 shapes