Vis4
Visualization Idiom
선택한 dataset, action, 그리고 target이 정해졌을 때, 적합한 visualization 방법, 즉 visualization idiom (How)을 결정해야 한다.
How를 결정하기 위해서는 크게 Encode, Manipulate, Facet, Reduce을 정해야 한다.
Encode
Arrange Tables
Spatial channel에 정보를 encoding 하는 방법이다. Spatial position은 visual channel 중에서 가장 효과적인 방법이다
Arrange는 spatial (position) channel을 사용하기 위해서 key, value, level을 정의한다.
- Key : Index처럼 사용되는 attribute으로 독립적이고 look up을 위해 사용된다.
- Categorical / Ordinal 한 attribute이다. (C, O)
- Value : Dependent variable
- Categorical / Ordinal / Quantative
- Level : Attribute 안에서 value 값으로 가능한 경우의 수
- ex) 성적은 A+ ~ F 까지 있음
이 key와 value을 어떻게 배치하느냐에 따라 Arrange 방법, 즉 visualization idiom이 결정된다.
Quantative variable encoding
Scatterplot
두 Quantative (Q) variable을 vertical, horizontal spatial position에 encoding하는 방법이다.
장점
- 전체적인 overview을 보기 좋고
- Distribution의 특징을 이해할 수 있으며
- outlier와 extreme values을 판단할 수 있고
- 두 variable의 correlation을 확인할 수 있다
단점
- Item 수가 많아지면 visual clutter가 발생해서 over-crowded 된다.
| Idiom | Scatterplot |
|---|---|
| What | Table. Two Q variable |
| How | Horizontal, vertical spatial position |
| Why | Find trends, outliers, distribution, correlation, cluster |
| Scale | hundreds |
Categorical Variable encoding
Categorical variable을 visualize 하게 되면 자연스럽게 group by가 적용되어 동일한 category에 존재하는 items는 모여진다.
Categorical varaible encoding의 방법에는 사용하는 key 수에 따라 나뉘어진다.
List Alignment: One key
- Bar chart
- 하나의 Q variable과 하나의 C/O variable (key)을 사용
- Value lookuip과 comparison에 좋음
- Scalability가 좋음
| Idiom | Bar Chart | | —– | ———————————————— | | What | One Q, One C/O | | How | line marks, key attribute in horizontal position | | Why | Lookup and compare | | Scale | key attribute: dozen to hundreds |
- Stacked Bar Chart
- Key는 두 개지만 spatial position을 사용하는 key는 하나만 사용한다
- 하나의 Q varaible과 두 개의 C/O variable을 사용
- Color가 없다면 두 번째 key는 의미가 없어짐
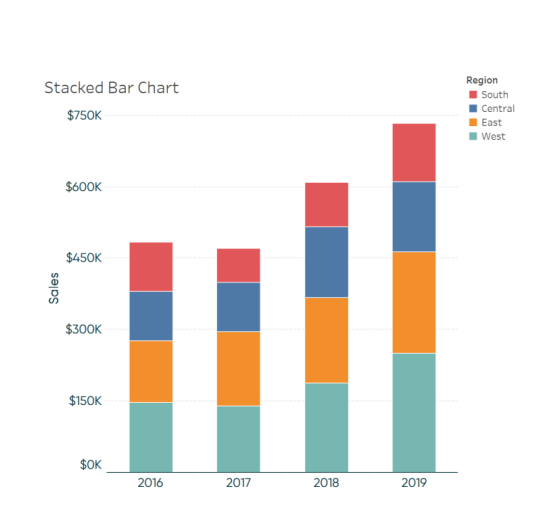
| Idiom | Stacked Bar Chart |
| ——— | ———————————————————————————————————————————- |
| What | Multidimensional table |
| How | Separate bars by category of primary key attribute |
| Why | Lookup values, find trends, part to whole relationship |
| Scale | Key attribute (main axis): dozens to hundreds of levels
Key attribute (stacked glyph axis): several to one dozen (보통 color) |
- Streamgraph
- Stacked bar chart to a continuous x domain
- 즉, main key attribute가 continous한 value인 time이다.
- Dot Chart
- One Q variable and one C / O variable
- bar chart과 비슷하지만 mark가 point mark이다
- Line Chart
- One Q varaible and one C/o varaible
- Connection mark을 사용하기 때문에 key attribute가 ordinal 해야 한다
- 중간에 비어있거나 ordinal 하지 않은 key attribute을 사용한다면 문제가 생김
- False maximum 문제가 생길 수 있음
- Connection mark을 사용하는 과정에서 정보 표현에 문제가 생김
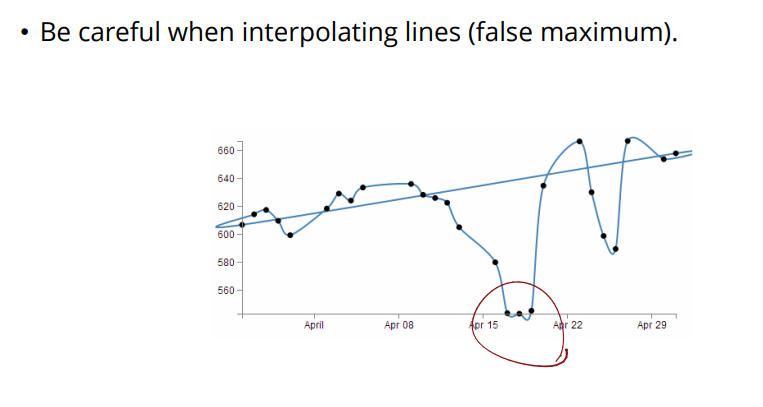
이런 문제를 해결하기 위해서 banking to 45 degrees (heuristic)을 사용 line chart는 기울기 정보가 중요한데 이건 x의 scaling에 따라 너무 달라짐. 따라서 45까지만 되도록 x의 scaling을 normalization을 해야 한다.
Matrix Alignment: Two key
- Heatmap
- 두 개의 C/O variable과 하나의 O/Q variable encoding
- mark는 area
- x와 y축은 key이고 value는 color (O/Q variable encoding)
- Overview를 보여주고 high information density 보여줌
- 하지만 color가 제한적이기 때문에 3~11 bins만 가능
- Color을 사용하고 color는 배경에 따라서 인식되는 정도가 달라지기 때문에 distortion 발생
| Idiom | Heatmap |
|---|---|
| What | Two categorical key attributes, one quantative value |
| How | 2D matrix alginment of area marks |
| Why | Find clusters, outliers, summarize |
| Scale | Items: one million, Categorical attribute levels: hundreds, Q attribute levels: 3-11 |
- Cluster Heatmap
- Heatmap에 추가로 rows와 columns 간의 similarity을 표현 가능
- 보통 hierarchical clustering 사용
- 기준에 따라 cluster 수가 미리 정해짐
- Mosaic Plot
- Two category을 표현하되 category의 빈도에 따라 폭이 달라짐
- Scatterplot matrix
- 두 attribute의 모든 가능한 combinations을 scatterplot으로 표현
- 무슨 attribute을 봐야하는지에 대한 knowledge가 없음
- 하지만 scatterplot이 실제로 정보를 전달하려면 Q attribute을 너무 많이 사용하지 못함
Volumetric Grid: Three key
Recursive subdivision 사용 가능
Axis Orientation
축의 방향이 꼭 perpendicular 하지 않아도 된다.
Parallel Coordinates
Parallel coordinates는 여러 Q variable들을 spatial position을 통해 보여줄 때 효과적이다
하지만 너무 많은 item이 존재할 때는 overplotted 된다.
Radial Bar Charts
Data type과 marks는 동일하고 오직 orientation만 달라짐. Line mark을 사용함
보통 length을 사용해서 encoding
이와 비슷하게 radar chart 있음. 선수 능력치 육각형 생각하면 된다. Polyline mark을 사용함. 하지만 하나의 item만 표현하는데 공간을 많이 잡아먹기 때문에 scalability가 큼
Pie Chart
하나의 Q attribute을 area mark와 angle channel 사용해서 encoding 함.
하지만 angle을 사용해서 area mark을 판단한다는 점이 덜 accurate하다.
Pie chart는 상대적인 contribution을 보여줄 때 효과적이다.
Radial orientation은 rectilinear orientation보다 이해 속도와 accuracy는 떨어지지만 cyclic patterns/ 주기를 표현하는데에는 효과적이다.
Beyond One Value per Key
보통 하나의 key마다 하나의 value 값이 존재했다. 하지만 하나의 key마다 하나의 distribution을 보여주는 것도 가능하다. 이것이 가능하기 위해서는 aggregation이 필요하다.
Histogram
하나의 quantative value attribute을 사용하지만 derive을 통해서 weight 값인 quantative attribute x을 범위를 나눠서 categorical 하게 바꿈 (aggregation)
Box plot / Vase plot
Aggregate statistical summary of values
Median, lower and upper quartiles을 계산한 다음에 Q1-1.5 x IQR, Q3+1.5 x IQR 을 계산하여 box plot.
그럼 outliers의 정보와 in-lier의 min/max 정보가 담김. 한 varaible의 distribution 정보를 visualization 함
Categorical attribute에 대한 distribution을 보여주는 plot으로 strip plot 또는 beeswarm plot도 존재
Sparkliones는 axes 또는 label 없이 그냥 trend의 shape을 보여줌 Density을 위해서 context는 제거됨